Published 2022-07-13
First look at Swift Charts
Using Charts
At last months WWDC Apple unveiled Swift Charts for SwiftUI, a new Swift library that enables a SwiftUI developer to make beautiful charts in the same declarative way that many of us have enjoyed with SwiftUI. In the app that I have been the lead iOS developer for the last 1.5 years, we use many charts, and the library we have been using is also called Charts Charts, and I have been impressed by the charts we have been able to produce with it.
The first thought I had when Apple showed the new Swift Charts library at WWDC, was if this could be a replacement for the Charts library we have been using? So for the last couple of days, I started my mission to see what I could do with one of the charts we have in the app. The result is at the short video at the end of this blog post, and as you can see, the result is quite impressive.
Prepare the data
I have rebuilt the app I am developing in my day job as a SwiftUI app, using iOS 16. That have been my private project for the last year, and in my last revision, I have replaced the Charts library with the new Swift Charts from Apple. I get the data as JSON from a backend server:
{
  "values" : [
    372.55000000000001,
    362.26299999999998,
    361.01299999999998,
    359.77499999999998,
    358.46300000000002,
    355.17500000000001,
    338.72500000000002,
    356.83800000000002,
    388.06299999999999,
    408.26299999999998,
    409.28800000000001,
    401.85000000000002,
    372.988,
    326.22500000000002,
    328.92500000000001,
    360.17500000000001,
    394.67500000000001,
    420.94999999999999,
    426.30000000000001,
    446.51299999999998,
    428.33800000000002,
    424.25,
    424.57499999999999,
    413.363
  ],
  "toDate" : "2022-07-13T00:00:00",
  "maxValue" : 446.51299999999998,
  "minValue" : 326.22500000000002,
  "fromDate" : "2022-07-12T00:00:00",
  ...
  ...
  ...
The values part is the 24 hours of electricity energy cost in norwegian øre from hour 00 through hours 23. And the fromDate and toDate is the start and end hours of the values. Now I want to show the energy prices during the day as a line chart.
The JSON is decoded into a struct:
struct CodableEnergyPrice: Decodable {
    let fromDate: Date
    let toDate: Date
    let maxValue: Double?
    let minValue: Double?
    let values: [Double]
}
and the struct have a computed property energyPriceData, that produces the simple struct that holds the charts data we will use in the line chart:
     var energyPriceData: EnergyPriceData {
        var data: [EnergyPriceDataValue] = []
        var hoursInt: [Int] = []
        hoursInt += 0...23
        let hours: [Date] = hoursInt.map { Calendar.current.date(byAdding: .hour, value: Int($0), to: fromDate) ?? fromDate }

        values.indices.forEach { index in
            data.append(EnergyPriceDataValue(hour: hours[index], øre: Int(values[index].rounded()), color: "blue"))
        }
        let minValue = minValue ?? 0
        let maxValue = maxValue ?? 1000
        let min = Int(minValue.rounded(.towardZero))
        let max = Int(maxValue.rounded(.awayFromZero))
        return EnergyPriceData(min: min, max: max, values: data)
    }
The EnergyPriceData is a very simple struct:
struct EnergyPriceDataValue: Identifiable {
    var id: String { UUID().uuidString }
    let hour: Date
    let øre: Int
    let color: String
}

struct EnergyPriceData {
    let min: Int
    let max: Int
    let values: [EnergyPriceDataValue]
}
First chart revision
(My first try at the chart made the marker showing the blue vertical line with the red dot at the far right in the preview, but the simulator and device showed correctly. After some experimenting I found out that the preview have a bug in Xcode 14.0 beta 3 that results in the date having an offset of 24 hours, that is why the computed property now have the two different calculations depending on if I want to show it in the preview or simulator.)
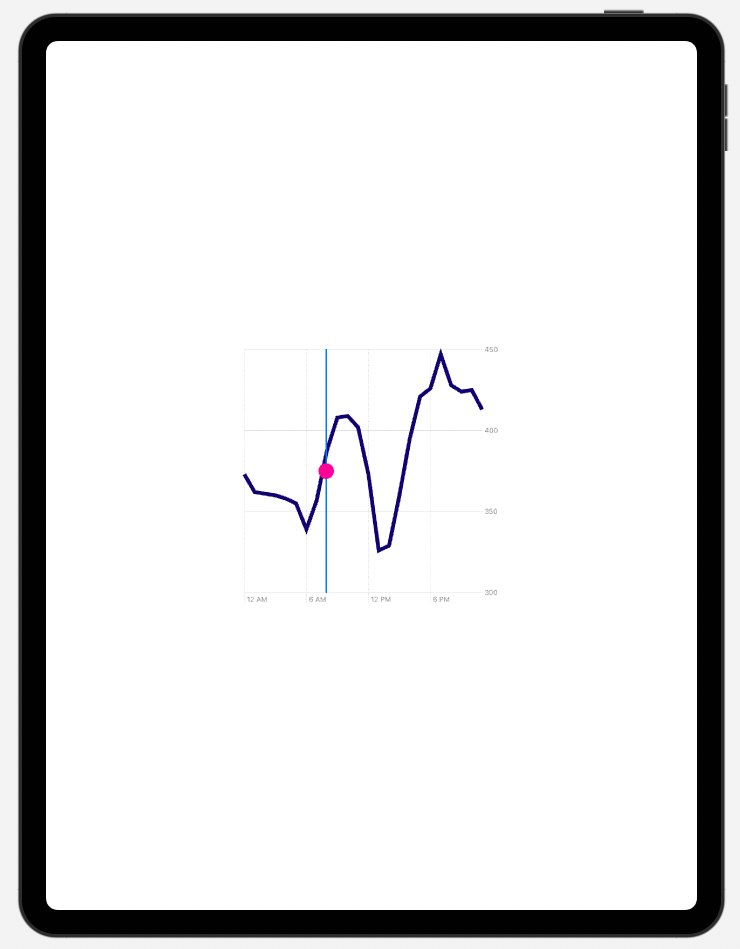
After some experimenting, I made the first line chart with the following code. Having used SwiftUI daily in the last two years, it felt very natural to code the chart declarative as the SwiftUI itself.
We start with the Chart itself, iterating over the energyPriceData values. For each data point we have a LineMark, which is the curve of the chart, and have view modifiers that sets the curve color to blue and thickness of the curve to 6.
I added the RuleMark, which is the vertical light blue line that is at the X position for the current hour. It gets the current time from the now computed property. I have annotated the RuleMark with the annotation view modifier, which contains a simple SwiftUI view element Circle with the pink color.
import SwiftUI
import Charts

struct EnergyLinePriceView: View {
    let energyPriceData: EnergyPriceData
    let blue = Color("newBrand/main/blue")
    let pink = Color("newBrand/main/pink")

    var now: Date {
        // preview:
        Calendar.current.date(byAdding: .hour, value: -24, to: Date()) ?? Date()

        // simulator and device:
        // Date()
    }

    var body: some View {
        Chart(energyPriceData.values, id: \.id) { data in
            LineMark(x: .value("Hour", data.hour), y: .value("Øre", data.øre))
                .foregroundStyle(blue)
                .lineStyle(StrokeStyle(lineWidth: 6))
            RuleMark(x: .value("Now", now))
                .annotation(position: .overlay) { context in
                    Circle()
                        .frame(width: 24, height: 24)
                        .foregroundColor(pink)
                }
        }
        .chartYScale(domain: .automatic(includesZero: false))
        .frame(height: 400)
    }
}

struct EnergyLinePriceView_Previews: PreviewProvider {
    static var previews: some View {
        EnergyLinePriceView(energyPriceData: PreviewEnergyPrice.priceData.energyPriceData)
            .frame(width: 400)
    }
}
Move y-axis to the left
In the chart in the original iOS app, we have the y-axis on the left. I found out after googling some blog posts that a view modifier to the chart could move it to the left:
Chart(energyPriceData.values, id: \.id) { data in
    ...
    ...
}
.chartYAxis {
    AxisMarks(position: .leading)
}
Adding gestures to the chart
In the original app, we could swipe over the chart to drag the marker line over the hours in the day, to get the electricity energy price for the hours, or tap on a specific hour to get the price for that hour. I wondered if it was possible to have the same feature withSwift Charts, I found a very good blog post An adventure in Swift Charts which helped me understanding how to make gestures work.
I found out that I had to add a chartOverlay modifier to Chart, which contains GeometryReader and a Rectangle with gesture modifier. That would be something like this:
Chart(energyPriceData.values, id: \.id) { data in
    ...
    ...
}
.chartOverlay { proxy in
    GeometryReader { geometry in
        Rectangle().fill(.clear).contentShape(Rectangle())
            .gesture(DragGesture()
                .onChanged { value in
                    updateSelectedDate(at: value.location, proxy: proxy, geometry: geometry)
                }
            )
            .onTapGesture { location in
                updateSelectedDate(at: location, proxy: proxy, geometry: geometry)
            }
    }
}
To combine everything together, the finished code for the view that makes the chart interactive with swipe and tap gestures, is the following code. The view is used in a presented view as in the video at the end:
struct EnergyLinePriceView: View {
    let energyPriceData: EnergyPriceData
    let blue = Color("newBrand/main/blue")
    let pink = Color("newBrand/main/pink")
    let secondaryGreyBlue = Color("newBrand/secondary/greyBlue")
    @State private var selectedDate: Date?
    @State private var selectedØre: Int?
    let onIntervalSelected: (Int) -> Void

    var now: Date {
        let date = Calendar.current.date(bySetting: .minute, value: 0, of: Date()) ?? Date()
        let newDate = Calendar.current.date(bySetting: .second, value: 0, of: date) ?? Date()
        return Calendar.current.date(byAdding: .hour, value: -1, to: newDate) ?? Date()
    }
    var costNow: Int {
        let price = energyPriceData.values.first(where: { now <= $0.hour })
        return price?.øre ?? 0
    }

    var body: some View {
        Chart(energyPriceData.values, id: \.id) { data in
            LineMark(x: .value("Hour", data.hour), y: .value("Øre", data.øre))
                .foregroundStyle(blue)
                .lineStyle(StrokeStyle(lineWidth: 6))
            if let selectedDate = selectedDate {
                RuleMark(x: .value("Selected date", selectedDate))
                    .foregroundStyle(blue)
                    .annotation(position: .automatic, alignment: .top) {
                        VStack {
                            Text(dateFromTo(with: selectedDate))
                                .enigFont(style: .body1Emphasized)
                            Text(ørePerkWh(with: selectedØre))
                                .enigFont(style: .captionEmphasized)
                        }
                    }

                PointMark(x: .value("Cost now", now), y: .value("Cost øre", costNow))
                    .foregroundStyle(blue)
                    .annotation(position: .overlay, alignment: .center) {
                        Circle()
                            .frame(width: 20, height: 20)
                            .foregroundColor(blue)
                    }
                if let selectedØre = selectedØre {
                    PointMark(x: .value("Selected date", selectedDate), y: .value("Selected øre", selectedØre))
                        .foregroundStyle(blue)
                        .annotation(position: .overlay, alignment: .center) {
                            Circle()
                                .frame(width: 20, height: 20)
                                .foregroundColor(pink)
                        }
                }

            } else {
                RuleMark(x: .value("Now", now))
                    .foregroundStyle(blue)
                    .annotation(position: .automatic, alignment: .top) {
                        VStack {
                            Text(dateFromTo(with: now))
                                .enigFont(style: .body1Emphasized)
                            Text(ørePerkWh(with: costNow))
                                .enigFont(style: .captionEmphasized)
                        }
                    }

                PointMark(x: .value("Cost now", now), y: .value("Cost øre", costNow))
                    .symbol(Circle())
                    .annotation(position: .overlay, alignment: .center) {
                        Circle()
                            .frame(width: 20, height: 20)
                            .foregroundColor(pink)
                    }
            }
        }
        .chartYAxis {
            AxisMarks(position: .leading)
        }
        .chartOverlay { proxy in
            GeometryReader { geometry in
                Rectangle().fill(.clear).contentShape(Rectangle())
                    .gesture(DragGesture()
                        .onChanged { value in
                            updateSelectedDate(at: value.location, proxy: proxy, geometry: geometry)
                        }
                    )
                    .onTapGesture { location in
                        updateSelectedDate(at: location, proxy: proxy, geometry: geometry)
                    }
            }
        }

        .chartYScale(domain: .automatic(includesZero: false))
        .frame(height: 400)
    }

    private func updateSelectedDate(at location: CGPoint, proxy: ChartProxy, geometry: GeometryProxy) {
        let xPosition = location.x - geometry[proxy.plotAreaFrame].origin.x
        guard let date: Date = proxy.value(atX: xPosition) else {
            return
        }
        selectedDate = energyPriceData.values
            .sorted(by: {
                abs($0.hour.timeIntervalSince(date)) < abs($1.hour.timeIntervalSince(date))
            })
            .first?.hour
        selectedØre = energyPriceData.values.first(where: { $0.hour == selectedDate })?.øre
        if let index = energyPriceData.values.firstIndex(where: { $0.hour == selectedDate }) {
            onIntervalSelected(index)
        }
    }

    private func dateFromTo(with date: Date?) -> String {
        guard let selectedDate = date, let toDate = Calendar.current.date(byAdding: .hour, value: 1, to: selectedDate) else { return "" }
        let from = Formatter.hourMinute.string(from: selectedDate)
        let to = Formatter.hourMinute.string(from: toDate)

        return "\(from)-\(to)"
    }

    private func ørePerkWh(with øre: Int?) -> LocalizedStringKey {
        guard let selectedØre = øre else { return "" }
        return LocalizedStringKey("\(selectedØre) øre per kWh")
    }


}

struct EnergyLinePriceView_Previews: PreviewProvider {
    static var previews: some View {
        EnergyLinePriceView(energyPriceData: PreviewEnergyPrice.priceData.energyPriceData) { _ in }
            .frame(width: 400)
    }
}